How efficient are racing markets?
I have been spending more time trading horse racing markets the past couple of months. They are attractive because the liquidity is high (they have the highest trading volume on the exchanges by a large margin), but the markets are also more efficient meaning it’s harder to find an edge.
Any time you buy a bet, you are implicitly making a statement of your belief about the probability of an event occuring. If a back bet has decimal odds (price) $p$, then we define the implied probability as
$$ \textrm{implied probability} = 1 / p. $$
By buying a back bet at price $p$, you are stating your belief that the probability of it paying off is higher than $1/p$. If this is true, your bet has positive expectation and you will make money in the long term (even if you lose this bet, you will make money over time repeating the experiment). On the other hand, if the bets pays off with frequency less than $1/p$, you will, on average, lose money.
One of the most basic questions we can ask of any prediction market, therefore, is whether the odds accurately reflect the outcome frequencies in the long term. When the market predicts that an event will occur with 30% probability, does that event occur, on average, 30% of the time? We expect that it does, because otherwise there is easy money to be made simply buying back bets (in the case that the true probability is higher) or lay bets (if it’s lower) every time we see odds with implied probability 30%.
In horse racing, you will often hear of the “favourite-longshot bias ”, where bettors allegedly assign higher probabilities to low frequency events (“longshots”) than they deserve, while undervaluing the favorites. Entire papers have been written supporting this bias with empirical data. But does it actually exist, in online racing markets in 2021?
We can investigate the favourite-longshot bias on Betfair by examining historical data. We do this by grouping historical bets into “bins” based on odds available at the start of the race, and then plot the actual frequency that the bets in that bin payed off.
import numpy as np
import matplotlib.pyplot as plt

def plot_series(data, n_bins):
    """
    :param data: list of (implied probability, outcome boolean) pairs
    :param n_bins: number of bins
    """
    probabilities = np.array([p for p, outcome in data])
    outcomes = np.array([int(outcome) for p, outcome in data])
    bins = np.linspace(0, 1, n_bins)
    digitized = np.digitize(probabilities, bins)
    bin_centres = [probabilities[digitized == i].mean() for i in range(1, len(bins))]
    bin_win_percents = [outcomes[digitized == i].mean() for i in range(1, len(bins))]
    sample_sizes = [sum(digitized == i) for i in range(1, len(bins))]
    plt.plot(bin_centres, bin_win_percents, 'o', color='black')

data = load_data()  # Load data from historical data source
n_bins = 10
plt.plot([0, 1], [0, 1], color='red')
plt.xlim(0, 1.1)
plt.xlabel('implied probability')
plt.ylim(0, 1.1)
plt.ylabel('win frequency')
plot_series(data, n_bins)
plt.suptitle("Horse racing win market outcome frequencies")
plt.title("UK, 6 months to March 2021", fontsize=10)
plt.show()
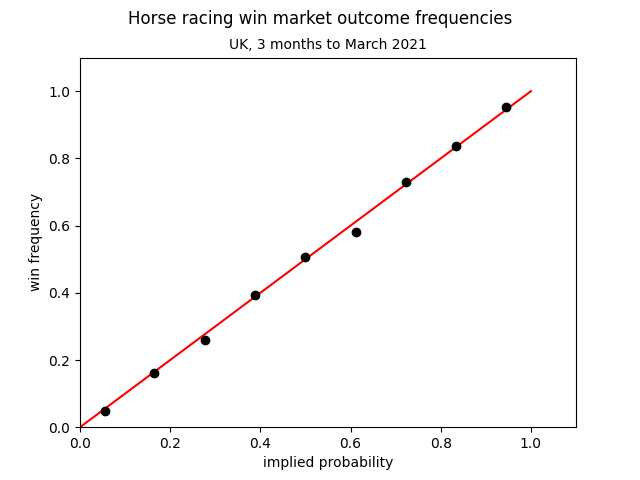
We assign each data point into a bin based on the implied probability, and for each bin, tally up the actual frequency that bets in that bin won. We also include a red line showing the expected result, in the case that win frequencies exactly matched what is expected by the implied probabilities. The result looks something like this:

Here I’ve taken the last 3 months of Betfair horse racing data across all UK win markets (not place), using the price of each horse 1 minute before the race began. Evidently, it’s very efficient, since the black points are very close to the red. It is unlikely that there is any systematic bias towards favourites or longshots.
If you want to investigate this yourself, you will need access to historical data – for example, via Betfair’s historical data service .
I would love to hear your feedback on this post! Email me at andrew@wrigley.io . You can also subscribe .